
Follow the Flow to Build a System
Someone asked me during a hackathon how I design systems. I said: structure — if you get the structure right, everything else follows.
That answer is correct. But if I got the chance to be asked again, I would add more context to it, and this is what I will be doing in this article.
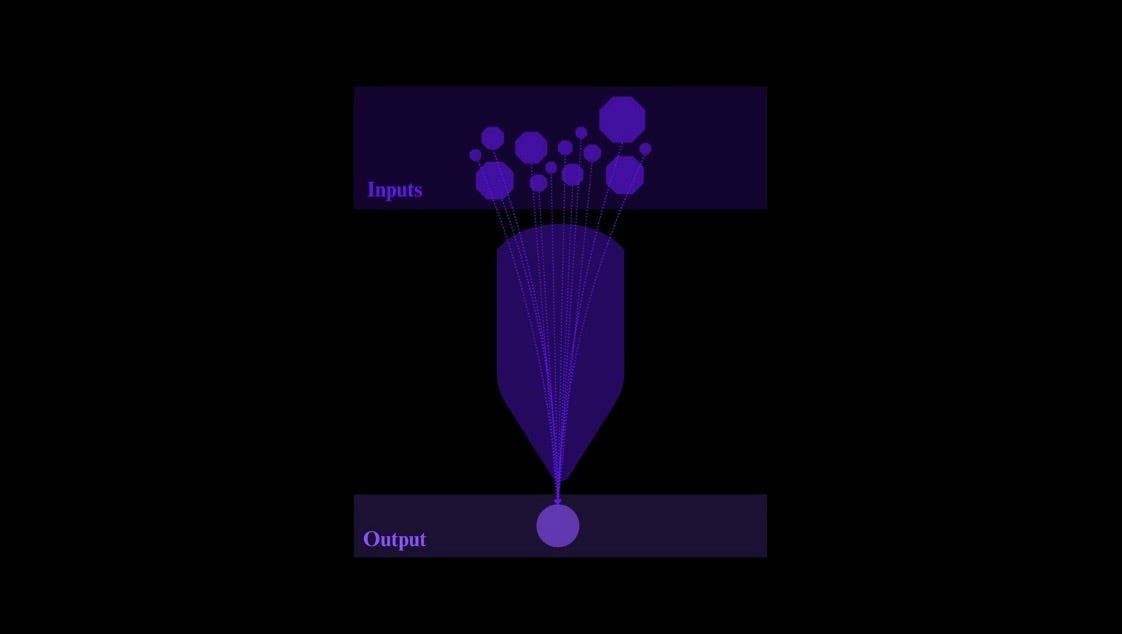
We can define a system as a mechanism that takes something in one state and transforms it into another — and every part of its design either serves that transformation or it doesn’t. The failure of a system is usually caused by the person who designed it: they never defined what the transformation was supposed to be, built the stages around tasks instead of states, chose mechanisms before defining what those mechanisms needed to produce, and specified the output by what the system generates rather than what the person receiving it needs to do with it. (see Figure 1.1)
Getting Back in Time to April 2026
In April 2026, RWTH Aachen University ran a three-day hackathon focused on the mining industry, where five companies with six challenges opened their problems to students from every field.
To be honest, I knew nothing about mining — I had never been in that field — but I thought it would be a nice experience anyway. The challenge I chose was from ANDRITZ, an Austrian industrial machinery company operating across separation technology, hydropower, and metals. Their ask was to build an automated system that analyzes industrial filtration curves and extracts process parameters from raw lab data accurately.
Since I knew nothing about mining, I took a step back and spent some hours understanding what filtration actually is — at the level of mechanism and application.
Filtration is the separation of solid particles from a liquid by forcing the mixture through a porous filter cloth, and the liquid passes through. Then the solids accumulate on the surface, building up a layer called the filter cake. In mining, this is how you remove water from mineral concentrate after processing — copper, lithium, iron ore, and rare earth elements all pass through filtration before they leave the plant. The cake that builds on the filter surface is a central variable in the process, because its physical properties determine how the entire system behaves under pressure.
The resistance to liquid flow comes from two sources: the filter cloth itself, which has a fixed resistance, and the accumulating cake layer, whose resistance grows continuously as more solids deposit. Engineers extract two parameters from any filtration experiment: specific cake resistance — a measure of how difficult it is for liquid to flow through the cake — and filter medium resistance, a property of the cloth alone. These two numbers determine pressure requirements, cycle times, and whether a filter design can handle a particular slurry at industrial scale. If the numbers are wrong, the decisions downstream of them are wrong — wrong equipment selection, wrong plant sizing, months of underperforming operation before anyone can identify why.
That is enough about mining for now. But what I wanted to point out is that in order to design a system, you need domain understanding — and that is not optional. Every structural decision in the system I designed later was a direct expression of how deeply I understood that domain. The parts I understood well produced clean design, while the parts I understood shallowly produced the components that needed to be rebuilt.
That is one part. The other part is that you need to understand the problem you will be solving — and that is not the same thing.
A problem is the gap between a current state and a desired state — and the distance between where things are and where they need to be is the problem. Systems exist precisely to close that gap. Someone has a current state they cannot accept and a desired state they need to reach, and the system is the mechanism constructed to perform that transformation reliably. Understanding the problem deeply is what allows you to design the system correctly — the more precisely you can define both ends of the gap, the more precisely you can design the transformation that closes it.
The problem ANDRITZ actually had was not that they wanted to draw curves, because the old workflow already produced curves — engineers would export raw data to Excel, identify the linear region of the t/V vs V plot by eye, draw a trendline manually, read off the slope and intercept, and convert to resistance values by hand. Sometimes an hour per experiment. Subjective enough that two engineers analyzing the same curve could arrive at different resistance values. Impossible to scale when characterizing a new material required twenty experiments and hours of analysis, bottlenecking a decision that needed to happen that week. (see Figure 1.2)
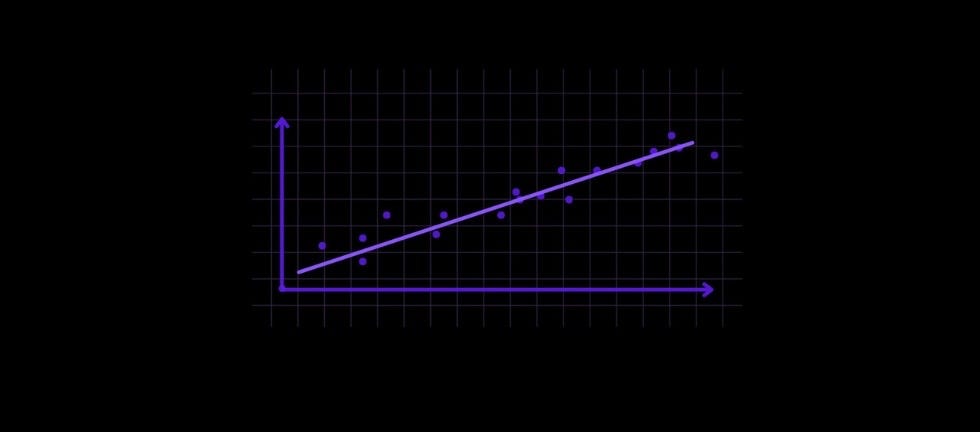
The real problem was that the evidence required to make a filtration decision was too slow and too unreliable to produce. The job the engineer was actually trying to do was make decisions under uncertainty, and the manual workflow was making that job slow, and inconsistent.
Understanding the problem at that depth changed the system I designed in ways that understanding only the domain never could have. It meant the output needed confidence scores alongside the resistance values, so the engineer could assess the reliability of what they were seeing. It meant the system needed to let the engineer draw their own region on the curve and compare it against the system’s detection, rather than just presenting a result and expecting trust. It meant data cleaning and normalization had to be built in from the beginning, because real lab data is noisy, irregularly sampled, and sometimes incomplete — and a system that only works on clean examples is not a system that works.
You cannot design a system well without both. So domain understanding tells you how the thing behaves. And problem understanding tells you what the person on the other end actually needs. Together they will define the transformation the system has to perform.
The Transformation Is the Design
The first point I’d like to emphasize is that transformation is the design, not the tasks. Tasks are simply a list of actions that the system should perform. Many people start designing the system around these tasks, which can feel productive because the list fills up quickly and the tasks appear concrete and actionable. However, the problem with this approach is that tasks lack direction. They describe actions but not outcomes. Therefore, you can complete every task on the list and still not produce the desired result, because the list doesn’t specify what the system should transform the input into.
A system is a transformation. So before you start designing components, you need to define two things precisely: what the input looks like when it enters, and what the output must look like when it leaves.
In the filtration challenge, raw measurement data comes off the lab device — pressure readings, volume measurements, time. What the engineer needs at the end is two numbers — specific cake resistance and filter medium resistance — in a form they can stake a decision on. The system’s only job is to take one and produce the other.
This anchor is what prevents a system from sprawling. Because without a defined transformation, there is no principle that limits what gets added, so you will end up in a situation where every feature is justified, and complexity will accumulate until the system becomes impossible to understand or maintain.
Stages Are States, Not Steps
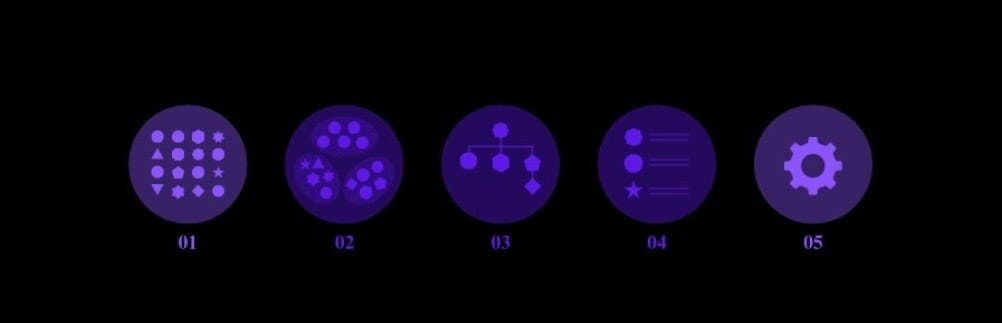
Once the transformation is defined, the question turns to how to cross the distance between input and output — and that distance is crossed through a sequence of intermediate states, each one a more processed, more structured version of the thing than the one before it. (see Figure 1.3)
Most designers, when they hear “break it into stages,” break it into steps — a sequence of actions the system performs. This is the same mistake as designing from tasks, just organized into a sequence. The problem remains that steps describe what happens, not what condition the thing must be in before the next action begins. And that condition is everything, because it is what makes a system diagnosable.
A stage is a state. It is a defined condition the thing must reach — verifiably, not approximately — before the next transformation begins. The distinction is important because states can be checked. After each stage, you can look at what you have and ask whether it reached the required condition. If it did, the next stage can begin. If it didn’t, the system stops there, and you know exactly where it broke. This is impossible with steps, because steps describe actions that either happened or didn’t — not whether the result of those actions is actually what the next stage requires.
In the filtration system, the stages were defined as states: raw input became validated and cleaned data, which became a reconstructed filtration curve, which became a curve with its linear region identified, which became extracted resistance parameters, which became a formatted output with confidence scores and an inspectable visualization.
Each transition was a transformation with a clear entry condition and a clear exit condition. The data at the end of stage three — a reconstructed curve — was categorically different from the data at the start of stage two — raw voltage and pressure readings.
The Mechanism Follows the State, Never the Other Way Around
Defining the stages tells you what each transformation must produce. It does not tell you how to produce it — and the how is the mechanism: the algorithm, rule, calculation, or process that causes the state change to happen. (see Figure 1.4)

The hardest stage in the filtration system was detecting the linear region of the t/V vs V plot. This region is where the data behaves according to the filtration model — it contains the information needed to extract both resistance parameters. The problem is that it is not labeled, not fixed, and not clean. The curve is noisy. The linear region shifts depending on the material being filtered, the pressure applied, and the quality of the raw data. An experienced engineer identifies it by eye — they look at the curve and draw a line through the part that appears linear, informed by years of seeing what that region looks like across different materials and conditions. That judgment had to become an algorithm.
We used RANSAC — Random Sample Consensus — a method that fits a model to randomly selected subsets of the data iteratively, scores each fit by how many points fall within an acceptable distance of the model, and converges on the fit that accounts for the largest consistent region while treating outliers as noise. It finds the linear region the same way an experienced engineer does — by looking for the part of the data that is most internally consistent — but deterministically, at any scale, and without the fatigue or subjectivity that makes manual analysis unreliable.
The reason this worked is the order in which the decisions were made. The state definition came first: we knew exactly what the stage needed to produce — a reliably identified linear region from real-world filtration curve data. That requirement, specified precisely, made the choice of mechanism follow almost logically. If we had started from the mechanism — if we had said “we know RANSAC, where can we apply it” — we might have applied it to the wrong part of the problem, or used it in a way that optimized for the wrong condition. The state tells you what you need. The mechanism is what you find in order to produce it.
The Output Is Defined From the Human End
Everything built so far — the defined transformation, the staged states, the mechanisms that drive each transition — culminates in an output.
The output is the final result in a form that the person receiving it can actually use to do what they need to do.
From the beginning, we understood that the engineer’s job was to make a decision — which filter cloth to order, or whether a particular slurry would behave correctly on existing equipment.
That understanding is the reason why confidence scores were a requirement and not an addition, and why the ability for the engineer to draw their own region on the curve and compare it against the system’s detection was built in from the design phase — because the system needed to support the engineer’s judgment, not replace it.
The Final Answer
Someone asked me how I design systems and I said: structure. What I should have said is that it is structure, but structure is something you arrive at by doing things correctly.
You understand the domain at the level of application, not definition, because shallow understanding and shallow structure fail in the same places.
You understand the specific problem at the level of what the person actually needs to do — not what they asked you to build — because those are often different things, and designing for the wrong one produces a system that solves nothing.
You define the transformation — what the input is, what the output must be, and the gap between them — before designing a single component, because without that anchor the structure has no gravitational center and complexity accumulates without limit.
You design stages as states, not steps, because states are verifiable and diagnosable in a way that actions never are.
You find the mechanism after defining the state it needs to produce, never before, because starting from the mechanism orients the system around what you already know rather than what the problem actually requires.
And you specify the output from the human end — from the act it needs to enable — because a result that cannot be acted on is not an output.